
About
An Interactive Storytelling Experience
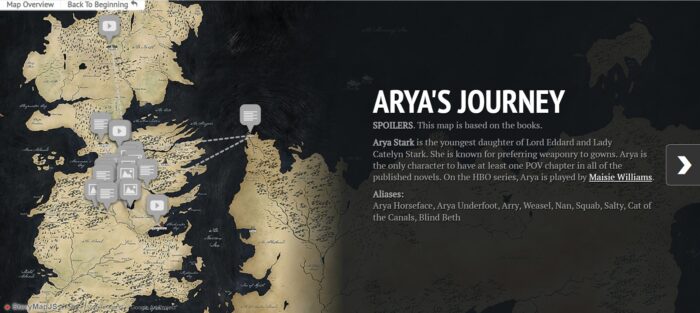
StoryMapJS allows you to create an interactive story using a “narrative map.” A narrative map is more focused on sharing a journey or story as opposed to just presenting data. From the Knightlab Staff at Northwestern University, StoryMap combines media (photos, video, and audio), text, and coordinates to give users a new kind of digital storytelling experience very different from a slideshow presentation or standard map. This tool can be embedded into your website to help make your research appear more interesting to your audience.
This tool offers more of a clickable experience to your audience as opposed to a slide show or Prezi. You have the ability to connect mapping to your research in a layout that presents information in a more polished way to make your website appear multi-dimensional. Accessibility-wise, your research can be easily read using proper editing without destroying the format of your website.
The following is an example of StoryMapJS from a previous Digital Humanities Summer Fellow.
Getting Started
To begin using this tool you will need:
- A Google account to create and save your StoryMaps. This requirement does not necessarily mean you need a gmail but rather any email that is connected to Google. For more information, visit Google Support.
- Previously collected data points/addresses to plot on your map.
- Photos that can be properly credited with Creative Commons Licensing.
Tutorials
Similar to these videos, this descriptive online PDF offers further explanations for how to use this tool.
Embedding StoryMapJS into WordPress
StoryMapJS and WordPress
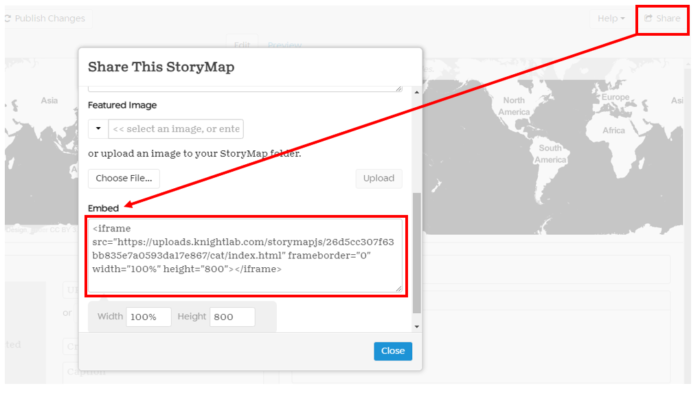
To embed StoryMapJS into WordPress, first create your StoryMap. Once you’ve saved the StoryMap and clicked Publish Changes (if it appears), click the Share button at the top right, then scroll down to the Embed section and copy all the code that starts and ends with the <iframe> HTML tags.
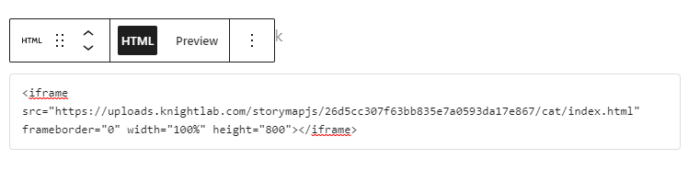
Then create a new Custom HTML block in WordPress, and paste in the code. You only need to do this once, if you make changes to the same StoryMap, it will automatically update in WordPress.
Limitations
StoryMapJS has very few mapping options to choose from which can cause creators to have to seek outside sources to construct something more complex. Also, because of its age, this tool tends to have connectivity and publishing issues where some of the content recently added may not preview or embed properly on your website. Thankfully, the tool eventually fixes itself usually within the same day.
StoryMapJS vs ArcGIS Story Maps
Both StoryMapJS and ArcGIS Story Maps share a similar mapping experience but with very different interfaces. Below is a comparison of the title slides and how research is presented between the two tools when points are plotted.
JuxtaposeJS was used to create this comparison. Using the arrow in the middle of both displays, drag from left to right to see the differences.
Using an Image to Tell a Story
StoryMapJS offers the option for creators to use an image versus cartography to build an interactive experience. Under the main options menu, you can transform your editing mode to feature one image with plotted points and descriptions that can be later added. This feature can be a valuable tool if you wish to have your users explore a piece of art or famous photo in greater detail. In StoryMap for Images, the Knightlab staff explains the way in which this tool can work for research purposes and how Zoomify can be a useful side tool for collaboration.
Documentation
- Google Doc from San Diego State University with a tutorial.
- Frequently Asked Questions from the Knightlab Staff.
- StoryMap for Technical Users acts as place for advanced creators to use StoryMap at its full technical capacity.