
About
ArcGIS Story Maps is a product from Esri that allows you to build long form interactive story maps. These story maps can include media, data visualizations, and geographic maps in their narrative.
What does it do?
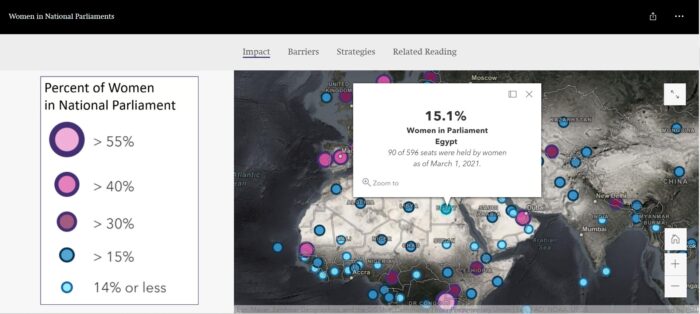
ArcGIS Story Maps creates a web page that hosts your story map. The interface of the Story Builder editor allows you to incorporate media and interactive elements to immerse readers in your story. You can create simple maps, insert GIS maps from an online library, and use other media to enhance your narrative.
Why this tool?
ArcGIS Story Maps can be used to tell a long form story of any type. Narratives do especially well on this platform, as do data or media driven story maps. Use this tool to create a webpage to present your research in an engaging and interactive format.
ArcGIS Story Maps can accommodate a lot of genres of stories. The curated collections of story maps pull out several topics or fields of study. They support maps in everything from data driven applied GIS (like Seabed 2030 Project’s Map the World Ocean) to narrative heavy digital museum exhibits (like the Smithsonian’s Right to the City). Explore the four collections below and the examples to decide if ArcGIS Story Maps is right for your project and gather inspiration.
- Arts and Culture– “Music? Literature? Philosophy? History? These stories explore it all.”
- Example Map- Voices of the Grand Canyon
- Causes and Advocacy– Using maps to champion causes.
- Example map- Behind the Conflict in Yemen
- Nature and Environment– View important ecosystems from home.
- Example Map- The Map of Biodiversity
- Applied GIS– Explore mapping with ArcGIS Story Maps.
- Example Map- How Deep is Challenger Deep?
Depending on the needs of your story, you may want to use ArcGIS Story Maps or StoryMapJS
Limitations
- ArcGIS Story Maps is still being developed and is subject to change. Features you were once familiar with are not guaranteed to stay the same.
- This is an online only tool, be sure to save text and data in another document or file
- Express maps are the easiest way to populate your story map with interactive media and maps, but they cannot be saved or duplicated. All data must be saved outside the Story Builder editor
Getting Started
You will need:
- An ArcGIS account through the college
- A wireframe for your story
- Maps, media, and proper attribution
Tutorials
Esri is constantly updating their supporting documentation for ArcGIS Story Maps. While features of this tool may change, there are five basic steps that you will need to take to build a story map. The five steps that Esri outlines are:
- One – Planning– Like wireframing(link), planning out your story map before you start will help you to develop a structure and make the most of this tool.
- Two – Story Builder– The editor interface for this tool is called Story Builder. This tutorial made with ArcGIS Story Maps shows you the different effects and widgets that are used in Story Builder.
- Three – Express Maps– Express Maps are created within the Story Builder interface. You can create detailed maps quickly after using this tutorial.
- Four – Design– Customize the appearance of your map with this tutorial.
- Five – Publishing– Share your story map with the public and input your sharing settings with this summary.
Documentation
ArcGIS and Esri online provide a lot of documentation and resources for Story Maps. Their Resources page has tutorials and tips and tricks to improve your projects, as well as how to plan out your Story Map. Their collection of tutorials will walk you through the basic and advanced functions.
For more common questions or to troubleshoot a problem, visit the Frequently Asked Questions page.
The ArcGIS Blog regularly updates when improvements are made. You can find more specific tutorials here as well.
The two most recent updates to the tool are:
The following tutorials and documentation were used in the introductory video. They walk you through how to use Express Maps and different navigation blocks.
- Express Maps
- Sidecar
- Guided Tour
- Explorer Tour
- Additional Blocks
ArcGIS Story Maps VS StoryMapJS
Both ArcGIS Story Maps and StoryMapJS create similar mapping experiences but with very different interfaces. Below is a comparison of finished products created using each tool.