Categories
Author: Katie Lauriello
Categories
Reflective Post 2
Citation: Witches – Mapping the Scottish Survey of Witchcraft Database by the University of Edinburgh
Summary: This project is a continuing adaptation of the “Survey of Scottish Witchcraft” database that was created in 2003. The original database, linked on the site after some searching, is essentially an advanced search engine with different filters and subjects, from “Accused witches by name” to “People involved.” These new maps were made to adapt and visualize those tried for witchcraft during the Witchcraft Act from 1563-1736 using various tools so users could get an accurate picture of who was actually accused, tried, and sometimes executed for witchcraft. Not only that, but the project also evolved to have case studies of certain people like the witch-pricker John Kincaid or alleged witch Isobel Young using other visualization tools. Though the original database’s audience may have just been researchers, judging by the extensive search options yet lacking visualizations, this new upgrade expanded it to people who may not know as much about Scottish history or witchcraft.
Claims and evidence: Using those maps, the creators are able to answer questions with their data. For example, they can show that the demographics of people accused of witchcraft may have been different than what people originally believed, and that most people accused according to the data were middle-class women. It also showed that many trials occurred in the cities of Edinburgh and Glasgow, and accused witches who were found guilty relocated to either of the two (mostly Edinburgh) for their execution. There are not so many questions that are asked and answered, however, as there are visualizations. Visualizations, while they may have come from a huge database to work from, did not have many analytical components on their own and instead furthered the original database’s “Introduction,” a general Q&A answering questions based on the data.
Technology: This project used LeafletJS combined with WikiData for primary visualizations with support from ArcGIS StoryMaps. Given that there are over 3,000 trials recorded as well as certain historical locations, it makes sense to pair with WikiData for sourcing and visualizing the demographics of these events. LeafletJS allowed for specific filters in their maps, which let the researchers determine the exact demographics of those accused and even the torture methods used in confession. Mapping Witchcraft does document where the data was taken from, as did the original database, and credits the sources they used while also linking their spreadsheets of data.
Issues: While there is a significant amount of visualization, there is little of analysis. What analysis was done was created or written by other people either from the original project or from contribution pages. Such analysis comes from the “Introduction” and “Further Reading” pages of the original witchcraft database. There was an issue with the loading time of some maps, particularly the map of “Involved People.” Everything still ran smoothly once it loaded, so I believe this came down to the quantity of data.
Categories
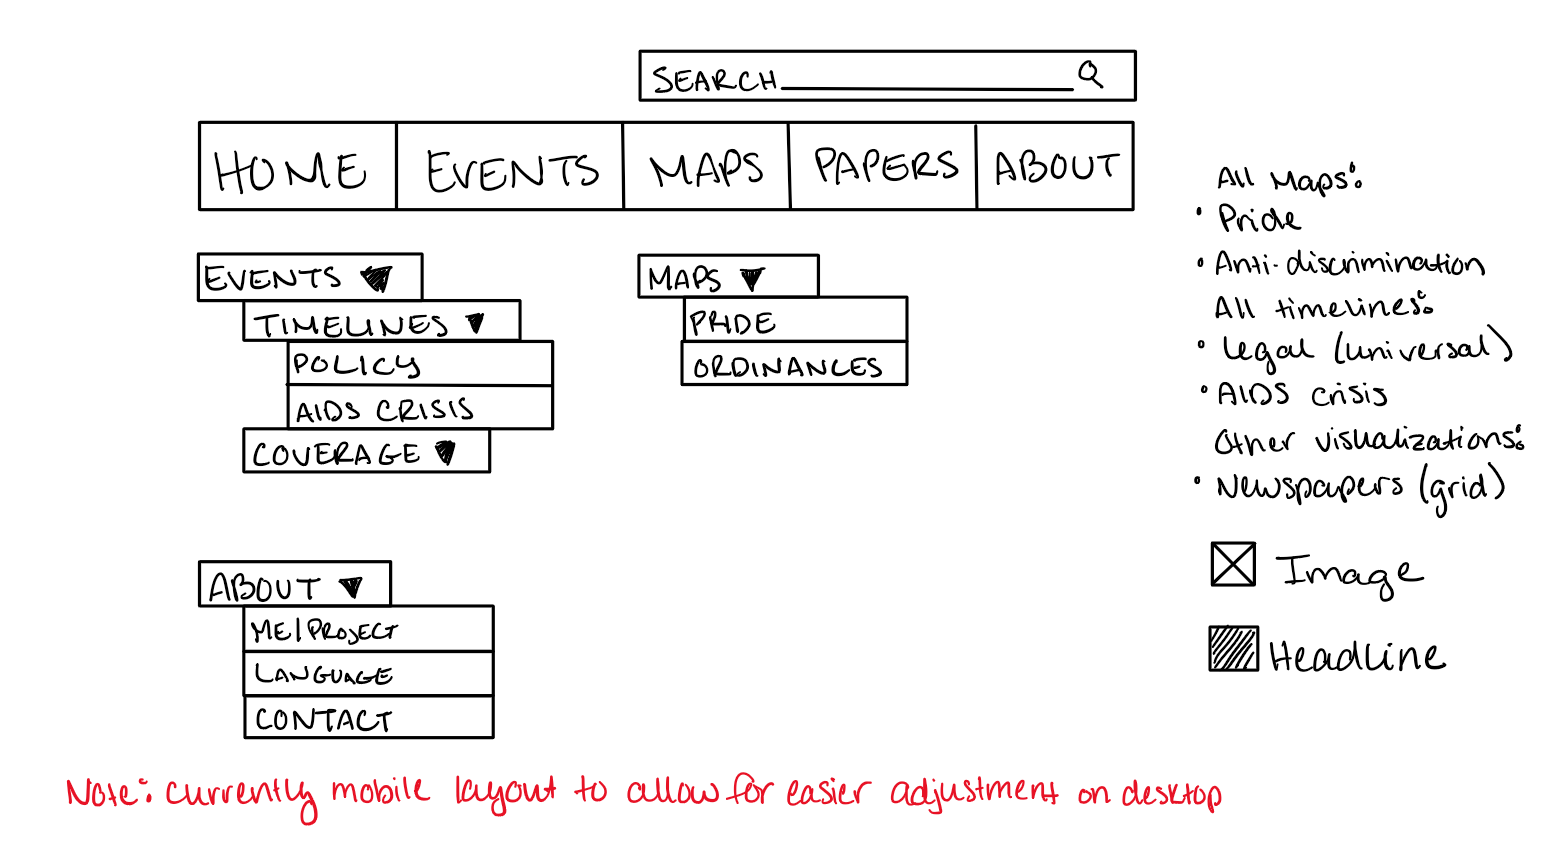
Wireframes


Categories
Project Charter
Project Name: In the Press: The Power and Struggle of LGBT+ People in Central Pennsylvania
Project Owner: Katie Lauriello
Project Summary
The experience of an LGBT+ person living in rural America is vastly different from those in urban populations, given the small population size and differing attitudes arising from such an environment. This project will document the struggles and accomplishments of those LGBT+ people within the local community beyond major cities like Philadelphia and Pittsburgh within Pennsylvania. I will examine local newspaper archives with the support from national papers and local LGBT+ papers of the time to document the struggles LGBT+ people faced as well as moments of pride, focusing especially on the first pride events in key areas, legal cases and policies changing the landscape for LGBT+ rights, and a survey of the HIV/AIDS epidemic. Such topics will be placed on a digital timeline and map in an easy-to-use format for users who may not have the time or patience to search for individual events. A more in-depth analysis of such coverage will also be provided, as well as a small guide to LGBT+ newsletters published in Central Pennsylvania.
Deliverables
- Persona
- Digital assets
- Scanned newspaper clippings (headlines)
- Images for pages
- Wireframe
- Tools
- TimelineJS
- StoryMapsJS
- Flourish
- Microsoft Excel
- WordPress
- Visualization
- Event timeline
- Location maps
- Newspapers (50-70 words)
- Events (50-70 words)
- Digital Tools
- TimelineJS
- StorymapsJS
- Flourish
- WordPress
- Event coverage pages (500-750 words)
- Exception: HIV/AIDS Crisis (1200 words max)
- Home page
- About section
- About the project
- About me
- About my tools
- Sources
- First draft
- Second draft
- Final project
Timeline
- Week 2
- Personas (6/14)
- Source List/Database
- Week 3
- Visit Dickinson (6/20)
- Wireframe (6/21)
- Newspaper/Newsletter Summaries
- 5 event coverages/analysis
- Week 4
- 5 event coverages/analysis
- Completed timeline
- Completed map
- Week 5
- Visualization (7/8)
- 10 event coverages/analysis
- Total source analysis
- About page content
- Week 6
- Total source analysis
- Home page
- First project draft (7/15)
- Week 7
- Second project draft (7/19)
- Week 8
- Final Presentation (7/26)
End of Life/Future Plans
Much of this project is centered around specific legal cases and Pride events, but there are many other people who have their own stories to tell that have not been covered. This project could be extended beyond the broader struggles to individual ones, incorporating a broader perspective through a local newspaper’s coverage of that person and support from their own oral history. If such a characteristic were to be implemented, then visitors can also submit their own collection of stories to the project, expanding it even further.
Categories
Project Persona
Part 1
Name: Aaron Smith
Age: 25
Location: York, PA
Education: Bachelor’s
Occupation: Junior Accountant
Income: $50,000/year
Hobbies: Watching reality TV, working out, going to gay bars
Tech experience: Intermediate: Uses Microsoft Office Suite extensively, streams movies and TV shows
Part 2
Aaron Smith is a 25-year-old gay man who lives in Central PA. He’s been working in an entry-level office job for a couple of years and wants desperately to get a better salary away from his awful boss. He goes to the gym each morning before work and has a couple friends there. Once he gets home, Smith is always exhausted from the monotony. He usually puts on reality TV shows and competitions to turn his brain off, especially Rupaul’s Drag Race. Lately he’s been curious if there are any queer people in the area. He knows one or two from the gym, but they can’t be the only ones despite their town’s small population. He has also been wondering a bit if there were other LGBT communities in the area that have existed or might still be around. Sure, he saw the Philadelphia Pride Parade once when he was just discovering himself, and he’s been to a few gay bars in the city, but that can’t have just been it. Smith wants to find out if there were more LGBT+ communities in his area and what they have done, but he needs a place to start. While he may have the technical knowledge to go searching for something, he won’t stay on a website that’s unwieldy to use for very long.
Categories
What is DH?
Both our introductory workshop as well as Dr. Amanda Visconti’s piece emphasized the complexity in identifying what makes a project something that falls under digital humanities. The key components, however, come down to an openness of the project to use digital tools in order to facilitate humanistic research. As we have discussed in class, such openness comes from several different angles. Not only must a project be accessible to the public, but it also must be open to feedback and critique. Visconti builds on this idea even more, using Document the Now and the Infinite Ulysses digital edition as digital humanities projects that build a community around the project, revealing both steps to their processes and setting up ways for their audience to communicate both with them as well as each other. As Visconti says, she values Digital Humanities for valuing interdisciplinarity and her connectedness to the community.
My DH tries to build on that same level of openness to the community through its collaboration. Gettysburg College’s Digital Humanities Fellowship is teaching me how to use digital tools effectively and giving me the space to complete my project, but there is no way I would have been able to pursue my project as effectively without the work that Dickinson College has done with the LGBT Center of Central Pennsylvania. Their work in documenting and digitizing the stories of LGBT people throughout the local area has been critical to spreading their stories, and my research is simply building upon those stories and boiling them down into a format that is easier to access.
My DH is also experimental in terms of what I will accomplish on a personal level. While I’m not treading any new ground in terms of digital tools, they are nonetheless very new. Visconti and everyone else involved in Digital Humanities has emphasized the importance of failure and trying new things. Learning digital tools and opening myself up to website design and data visualization is a whole new world, and DH has welcomed me into the fold eagerly.
Visconti’s piece has not changed much of what I learned throughout the first week, especially the first workshop. Instead, it has built upon the ideas of connection and collaboration that we agreed upon in our workshop and applied it further. She celebrates the idea that digital humanists value “a variety of skills and professional roles,” noting that all scholars are credited. While the space is not completely perfect, the attitude towards community and collaboration is something I value as well in my DH.
As Visconti has said in the beginning of her piece, my DH is rooted in the humanities both as a primary source and as a mode of inquiry. One of my central questions I will ask throughout my research is simply, “How are the language and tone shifting in each article?” Journalists are human, and they have their own biases. Part of my project involves analyzing where this bias will shine through and possibly discovering patterns between my sources.
My DH will be an effort in collaborating with both the local community and other people within the Digital Humanities Fellowship to perform humanistic research and learn digital tools along the way.